A crucial step of the image processing done by AtlasXbrowser, is the location of the Region of Interest (ROI) of the image corresponding to the section of tissue where the A and B chips overlap. This is made much easier by flowing Bovine Serum Albumin (BSA) solution mixed with
fluorescent dye through the outmost channels of both the A and B chips. These fluorescent colors will make it visually very
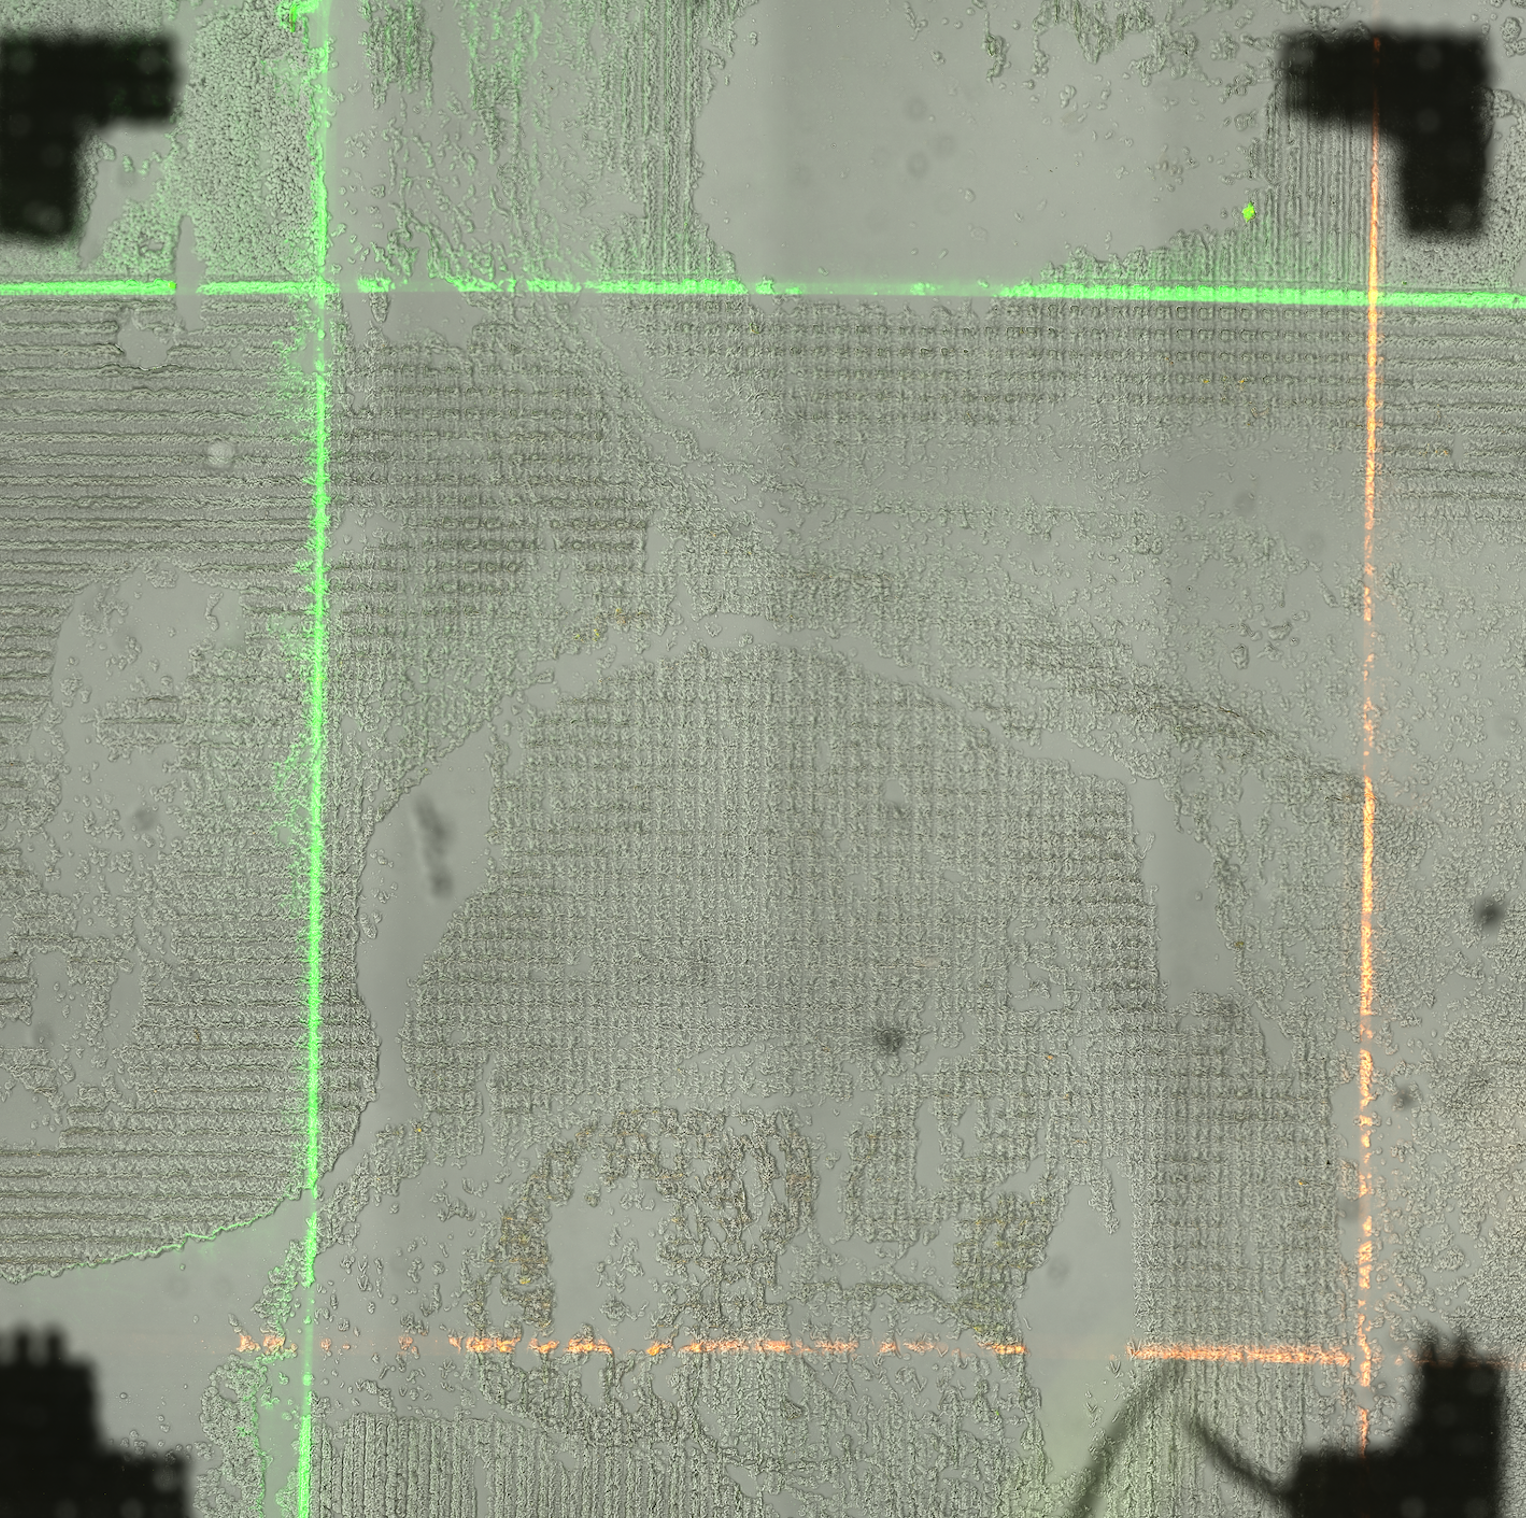
clear where the ROI is. As shown in the image below, the ROI is enclosed by this colored square.
Note: We recommend using two different colors of fluorescent dye on each chip to ensure the image is in correct orientation.
NOTE If using a purchased AtlasXomics kit, proper orientation would be to have the green channels on the left and top of the image.
The only image used for AltasXbrowser processing is the BSA image, with the fluorescent outside channels of the ROI in view.
BSA Image: Image taken using the epifluorescence setting of the microscope.
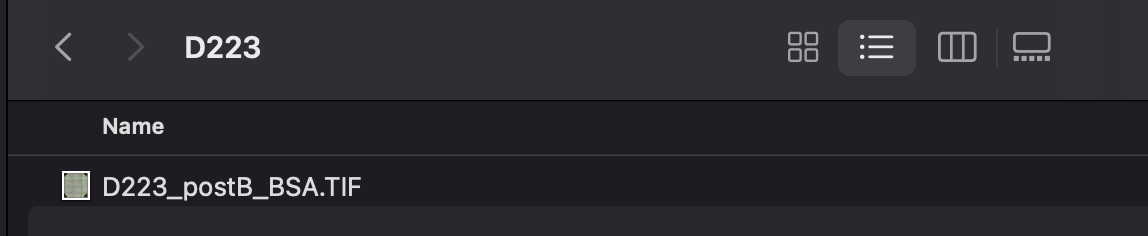
Above is the BSA image taken for AtlasXomics’ internal run D223. Observe how the fluorescent lines of the outside channels are clearly visible in the image.
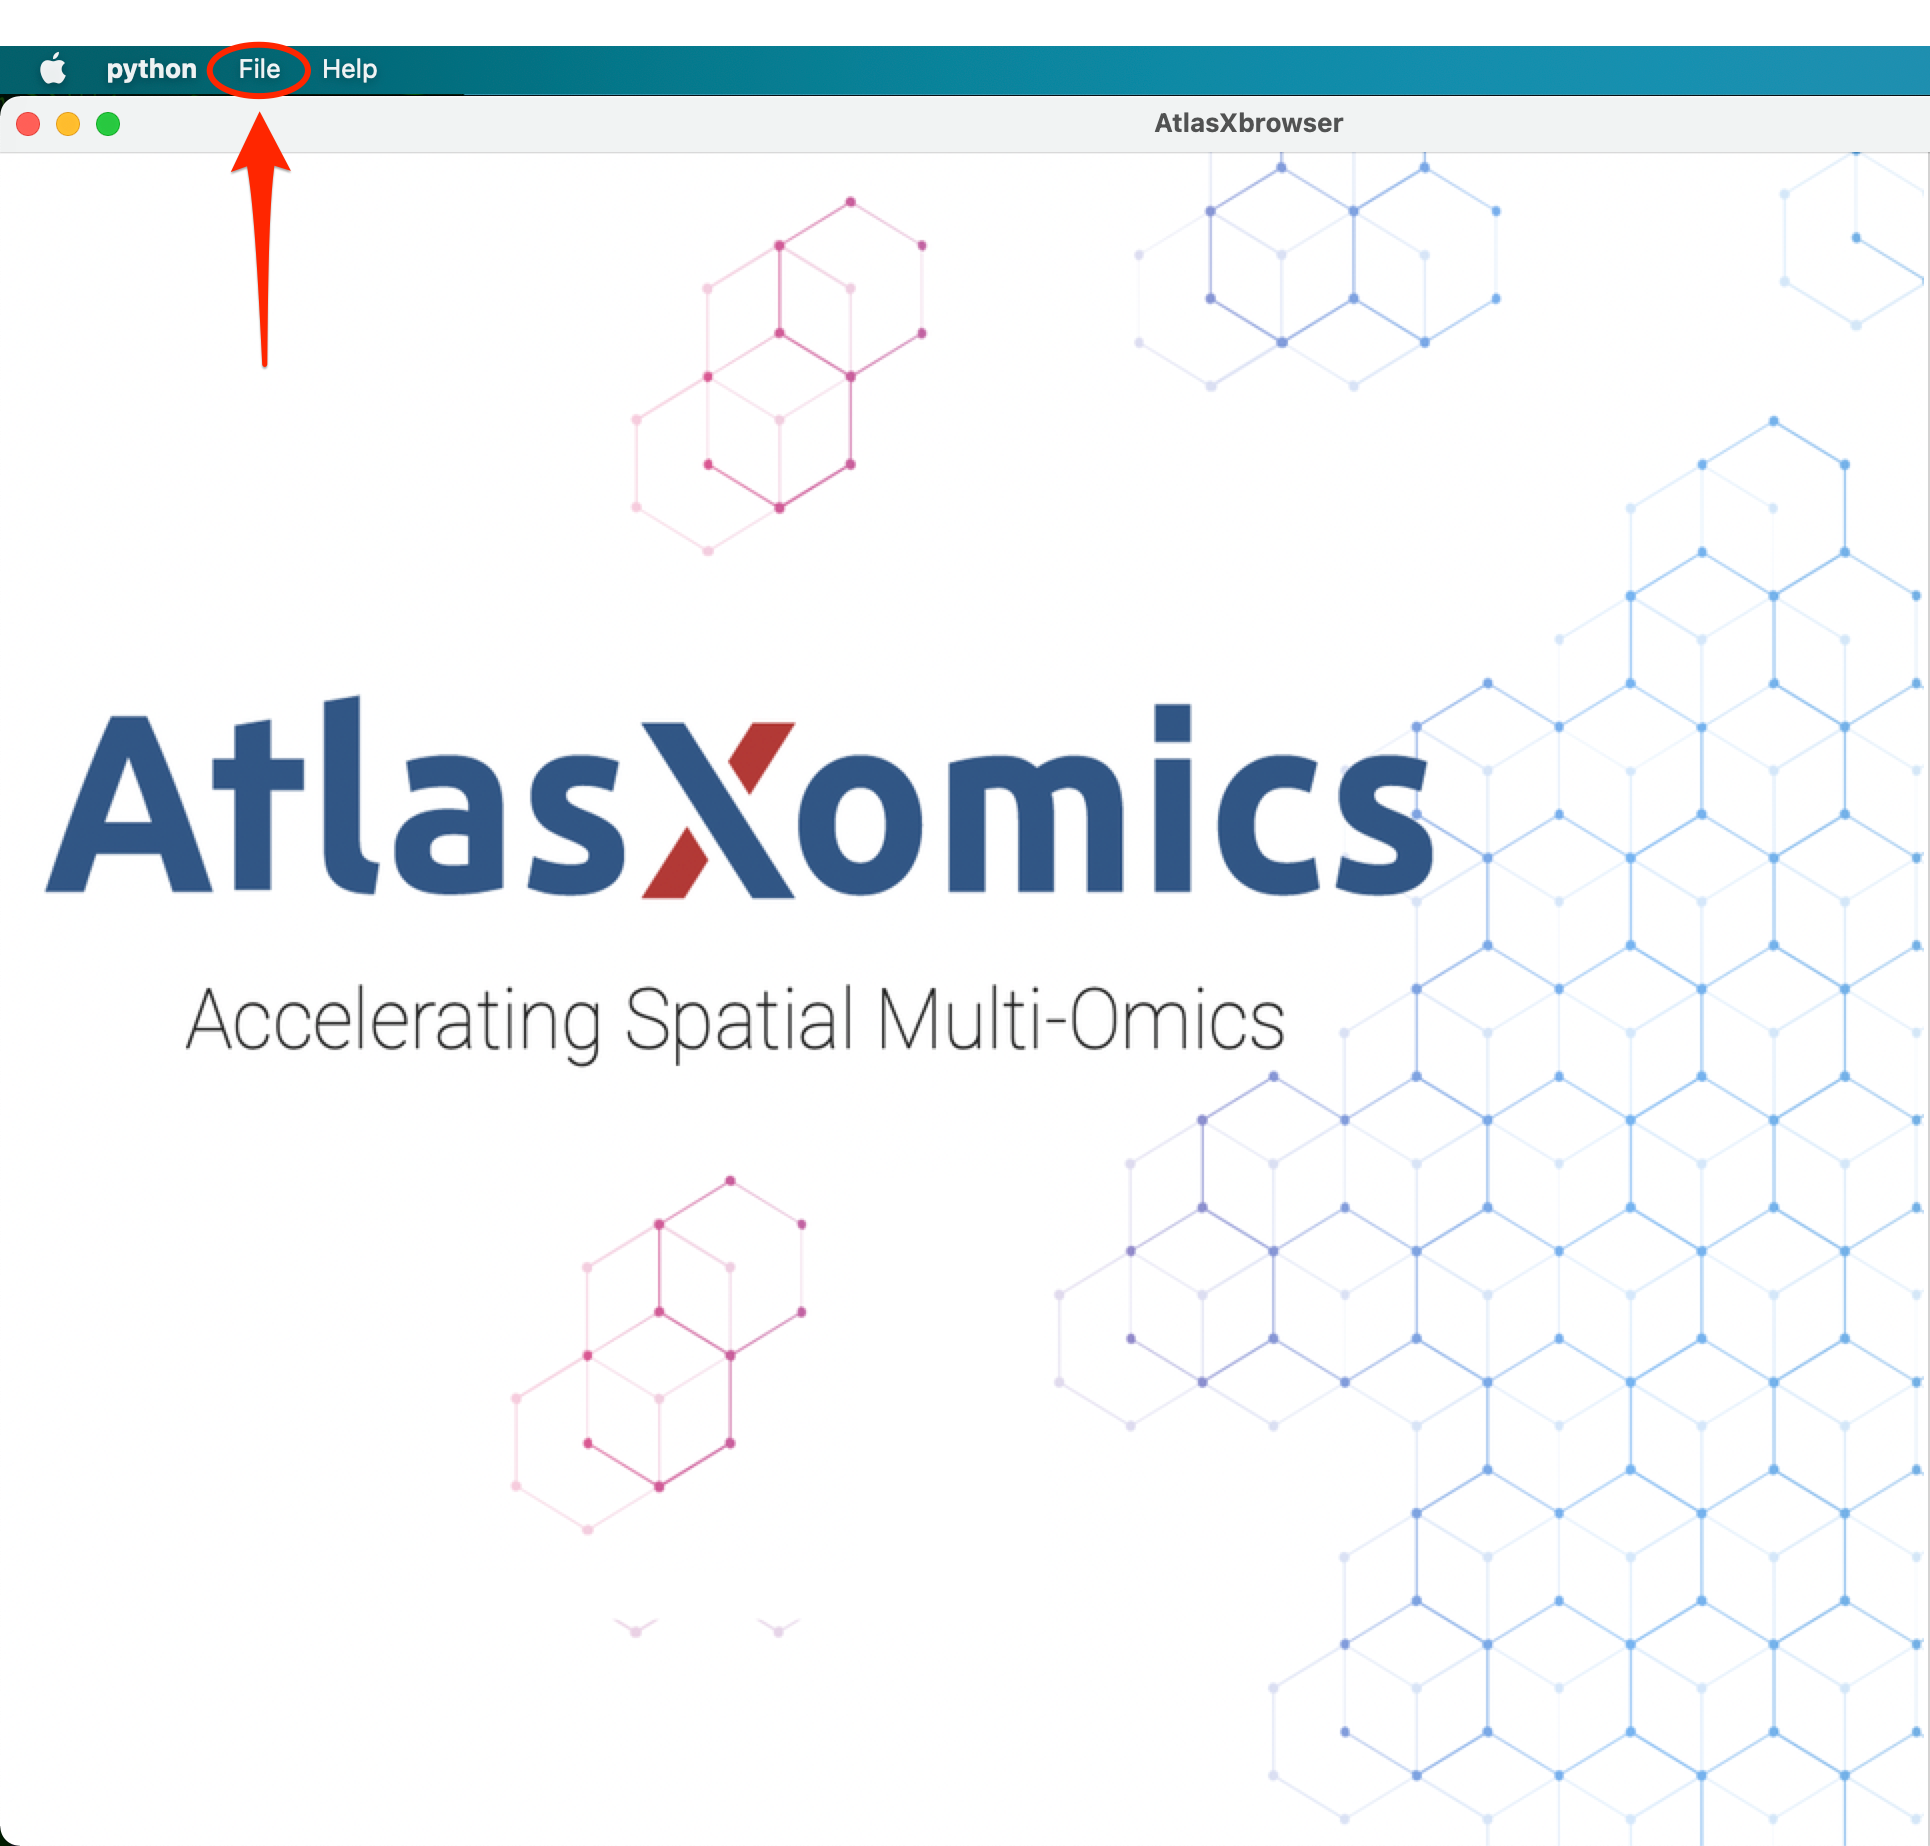
In order to begin processing the tissue image, the first step is to load the relevant images.
Navigate to the File tab in the top left corner of the screen.
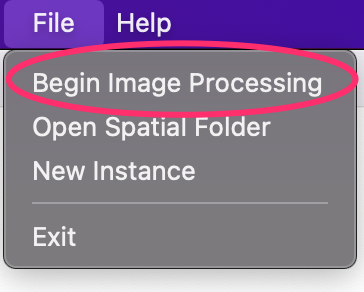
Select “Begin Image Processing”.
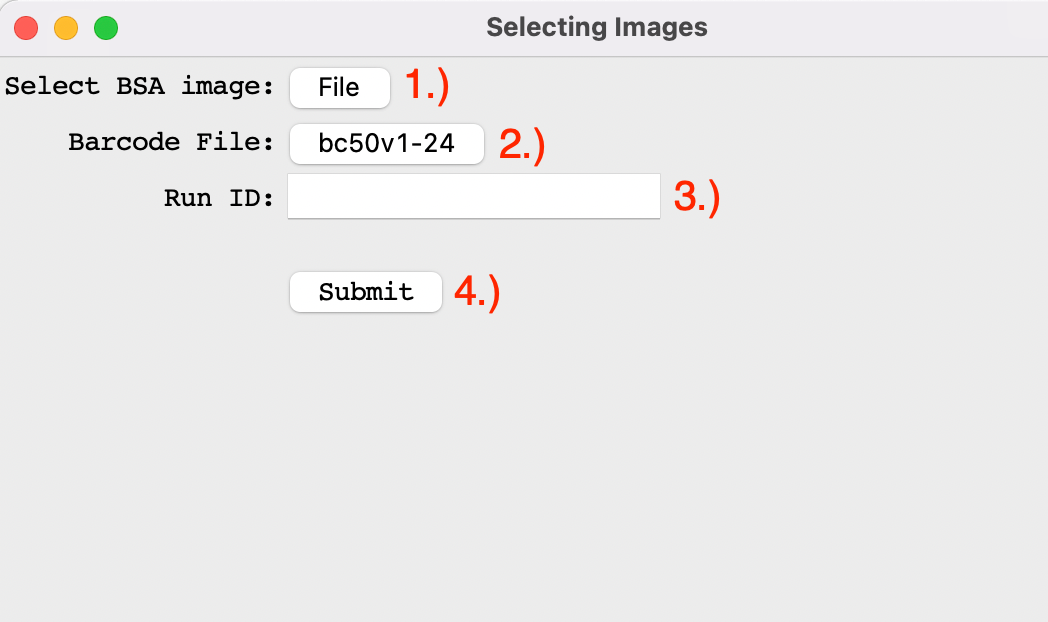
Once selected a pop-up window should appear on screen.
1.) Select File in the first row of the pop-up titled, “Select BSA Image”. Then navigate to the directory
of the image folder, and select the BSA image.
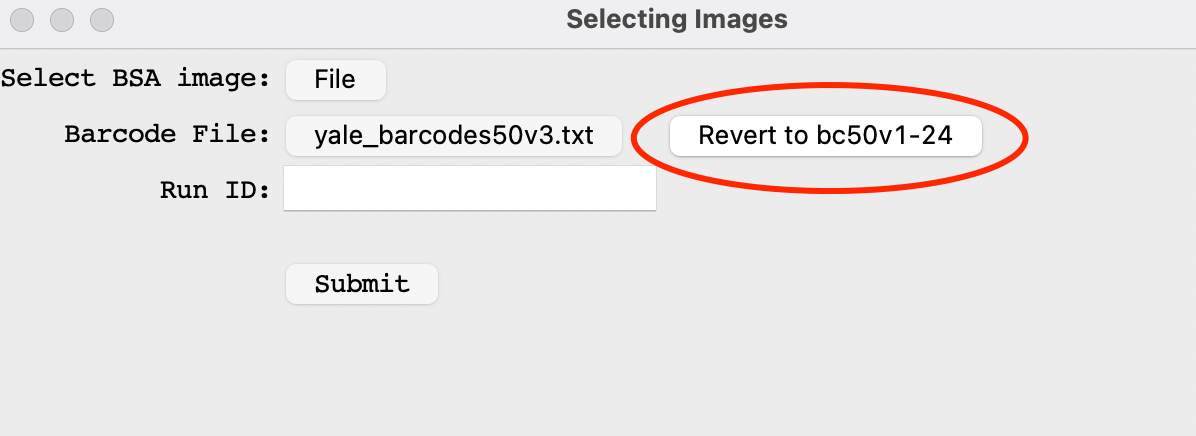
2.) This button is used to select a custom barcode file. Automatically the default bc50v1-24 barcode file is selected. To Change this, select the currently labeled bc50v1-24 and navigate to the desired custom barcode file.
Upon selecting a custom barcode file, if the user wants to revert to the default bc50v1-24 file, they can select the Revert to bc50v1-24 circled above.
3.) Enter the desired name of the run (or data set) in the text box.
4.) Once the images have been loaded in without error, and the run ID entered, select Submit to continue with the image processing.
Upon selecting Submit, the popup should disappear and the BSA image should be loaded into the main window of the Browser.
This metadata will be saved and stored in the associated Spatial Folder for this experiment. Now we can proceed to configuring the image.
As noted above, during the image loading process, the user is given the option to specify a custom barcode file to be used in AtlasXbrowser. The barcode file specified at this step is used when
generating the tissue_position_list.csv file, as part of the spatial folder. To learn more about the contents of the spatial folder, please see the Utilizing Spatial Folder section of the documentation.
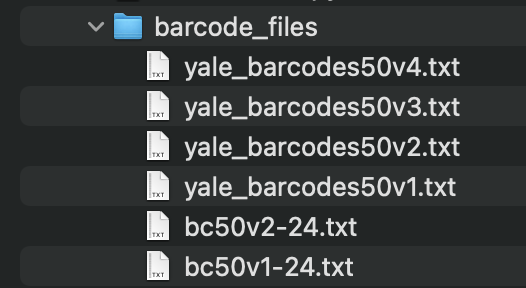
To view the barcode files that are included in the github repo, navigate to the “barcode_files”.
Shown above are the contents of the barcodes folder within the github repo of AtlasXbrowser.
yale_barcodes50 v1-v4: These are the barcodes used in the initial DBiT Paper published by The Fan Lab. The v1 - v4 indicate the orientation of these sequences.
v1: Standard Orientation
v2: Flipping the B chip barcodes relative to v1
v3: Flipping of the A chip barcodes relative to v1
v4: Flipping of both the A and B chip barcodes relative to v1
bc50v[1-2]-24: These are the barcodes currently being used and recommended by AtlasXomics for ATAC seq. Two of the B chip barcodes have been replaced from the original Yale barcode batch.
The bv50v1-24.txt file is the default barcode file within AtlasXbrowser.
The v1 and v2 orientations of these barcode files match that listed above. Where v2 has flipped B chip barcodes relative to v1 and so forth.
Depending on the specific barcodes used in the DBiT process in the wetlab, any of these files can be selected during the image loading step.