Overview
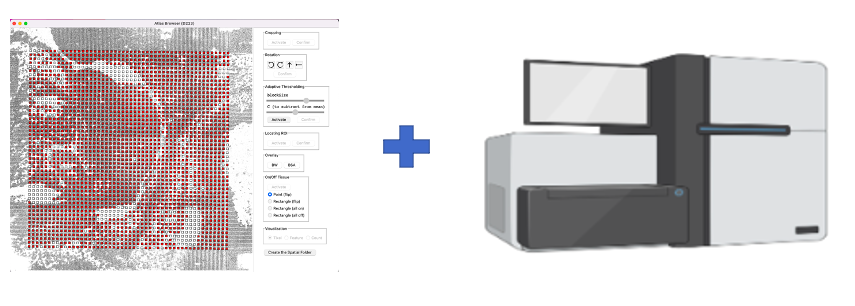
AtlasXbrowser was built to help facilitate the image processing aspect of the DBiT-seq workflow. Taking in both a brightfield and epifluorescent image of the chipped tissue, AtlasXbrowser guides the user through the steps necessary to generate a “Spatial Folder”. This folder contains the output of the image processing in 10x Visium image data format, allowing for easy incorporation into bioinformatics packages used in spatial seq analysis.
AtlasXbrowser Workflow
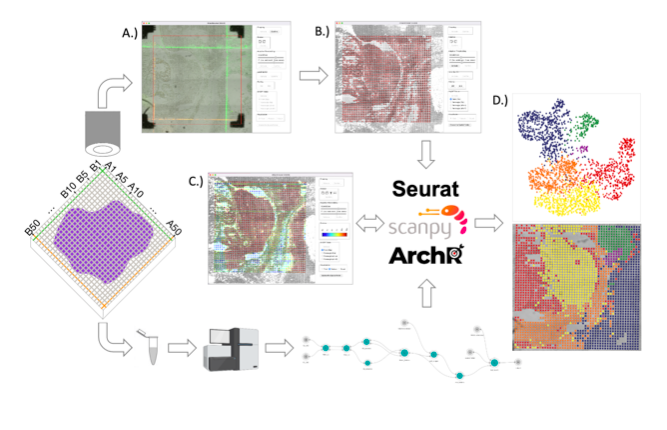
As seen in the figure above, following the removal of the B chip and the flowing of fluorescently stained BSA, the images are taken. From here they are loaded into AtlasXbrowser, and prepared for sequencing in parallel. On the image processing side, AtlasXbrowser guides the user through identifying the Region of Interest (ROI) corresponding, to the section of tissue in which Chip A and B channels overlap. Following this, the image is binarized using adaptive thresholding, creating a black and white version of the image. Using the binarized image, AtlasXbrowser predicts which regions of the image correspond to biological tissue and which do not. With on and off tissue sites delineated, the Spatial Folder corresponding to that particular run can be created. While the image processing in AtlasXbrowser is occurring, tissue containing the DBiT barcodes can be sequenced. Once that data is generated, it can be coupled with the information of the Spatial Folder to perform bioinformatic analysis. As seen on the right of the image, examples of this include UMAP or Spatial Clustering. At this point, once the reads of the tissue are obtained, the obtained counts in conjunction with the spatial folder can be loaded back into AtlasXbrowser, to both make adjustments about what is considered on and off tissue, and perform quality control on the DBiT run.
From a distance, a DBiT run works by:
Adhering tissue sample of interest onto a glass slide.
Clamping chip A on top of the slide and flowing Chip A barcodes through tissue.
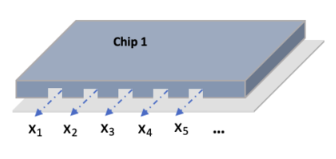
The A chip flows DNA barcodes in vertical channels down the slide. Using the unique molecular identifier (UMI) associated with these barcodes allows placing an x coordinate on reads once the sequencing is performed.
Removing A chip and clamping B chip onto the slide.
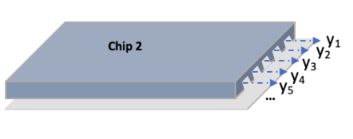
The B chip flows DNA barcodes in horizontal rows across the slide. The UMI associated with each of these barcodes allows for a Y coordinate to be inferred from a read.
From here pictures are taken of the glass slide, following the removal of the B chip.
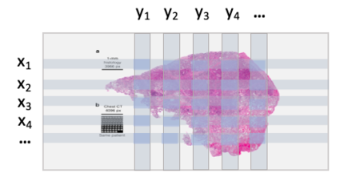
After the B chip is removed, an X-Y plane has been created by the A chip barcodes flown across the tissue, and the B chip barcodes flown down the tissue. As such, any space on the tissue that has had both barcodes from the B and A chip flown through it can have any reads sequencing from that region mapped back onto that spot in the image. These regions are called Tixels. Tixels are the basis of how spatial information is encoded from the DBiT process.
From here the two steps of loading the images into AtlasXbrowser as well as sequencing the tissue can begin in parallel.
As neither step is reliant on the other, AtlasXbrowser can be used to generate information about the image such as the metadata corresponding to the experiment, the boundaries of the overlapping A and B chips, and the classification of on and off tissue sites of the image, during, before, or after the tissue is sequenced.
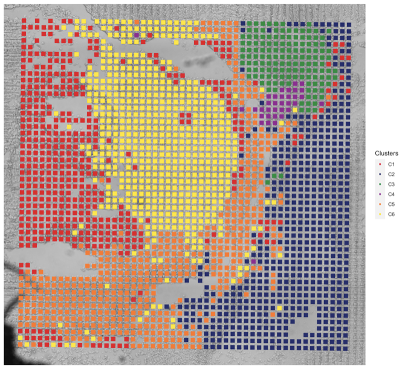
Using the results of the sequencing in conjunction with the spatial information encoded by the DBiT process, any bioinformatic analysis can be run on the data, like the spatial clustering shown below.
DBiT and other spatial sequencing techniques are so useful, as they allow researchers to interrogate omics data without losing the spatial context they occur in. Our goal with AtlasXbrowser is to facilitate DBiT sequencing within the research community and make these insights available to a larger group of people.